MMM 2.0 is not about algorithms. It is the engine for a step-change in Marketing Resource Management for multi-brand portfolios.
Company X
Imagine Company X: operating in 5 countries across 3 categories with 5 brands each that are advertised in 10+ channels (more every year!). Budgets are scrutinized once per quarter.
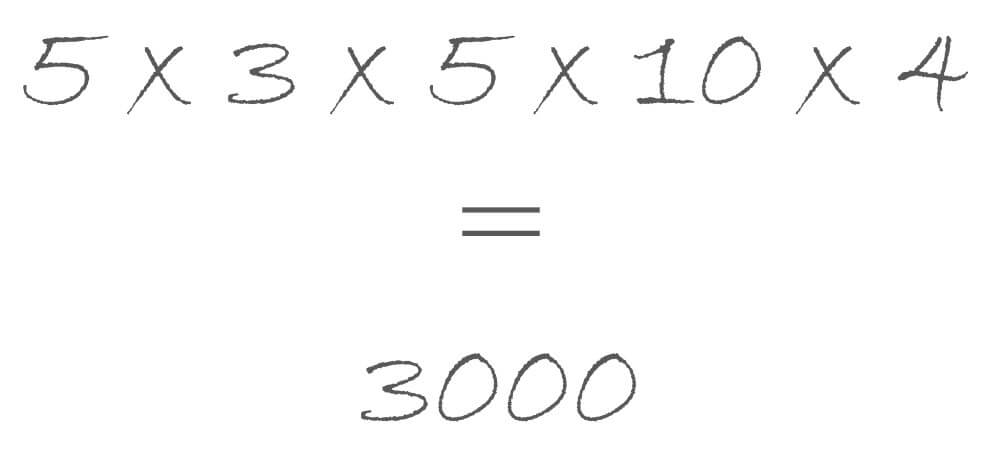
Company X is making 3.000 budget allocation decisions per year. Consciously or not doesn’t matter, they are being made. Should that be left to rules of thumb or “who screams loudest”?
MMM 1.0
Marketing Mix Modeling is not new.
But let’s be frank about it: 90% of advertisers never did it (no data, no time, no skills – or a little afraid of the outcome). And many of the remaining 10% approached it along those lines:
“MMM means Media Mix Modeling. Media is not my main lever anyway.”
“We do it every 3-5 years to prove something to HQ or CFO.”
“The media agency offers some out-of-the-box MMM for free, so why not. There might be a conflict of interest but hey – it’s free.”
“And if we don’t like the results, the PPT goes in the drawer. The world is changing so fast anyway.”
OK. We can go on like this and then complain why Marketing budgets are the first to be cut. Or we don’t…
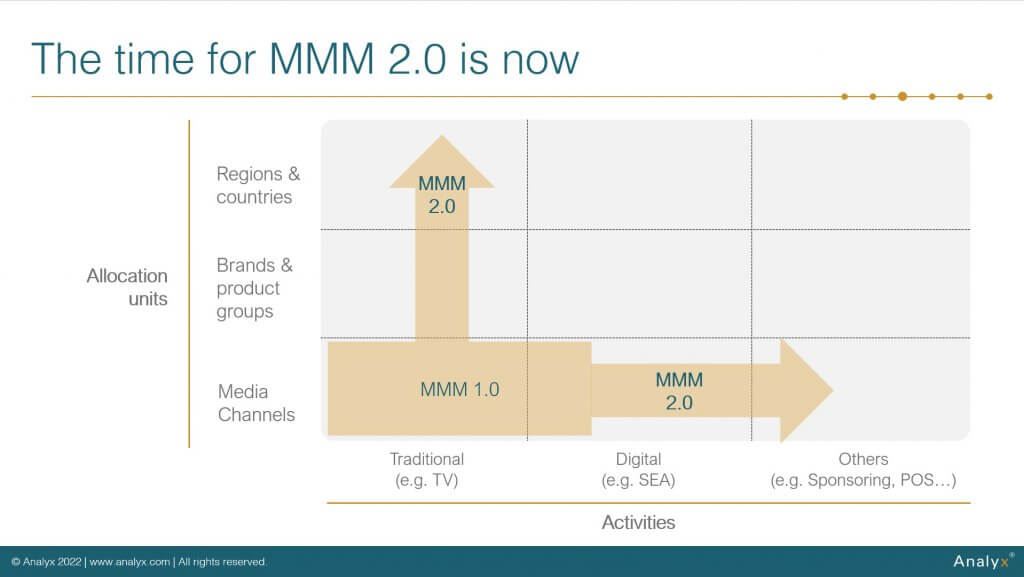
MMM 2.0
At the core of MMM 2.0 is the understanding that this is not about backward-looking proof of ROIs. It is the notion that state-of-the-art MMMs form the backbone of Agile Marketing Budget Optimization across countries, brands, product groups and channels.
So, what are the key ingredients of MMM 2.0?
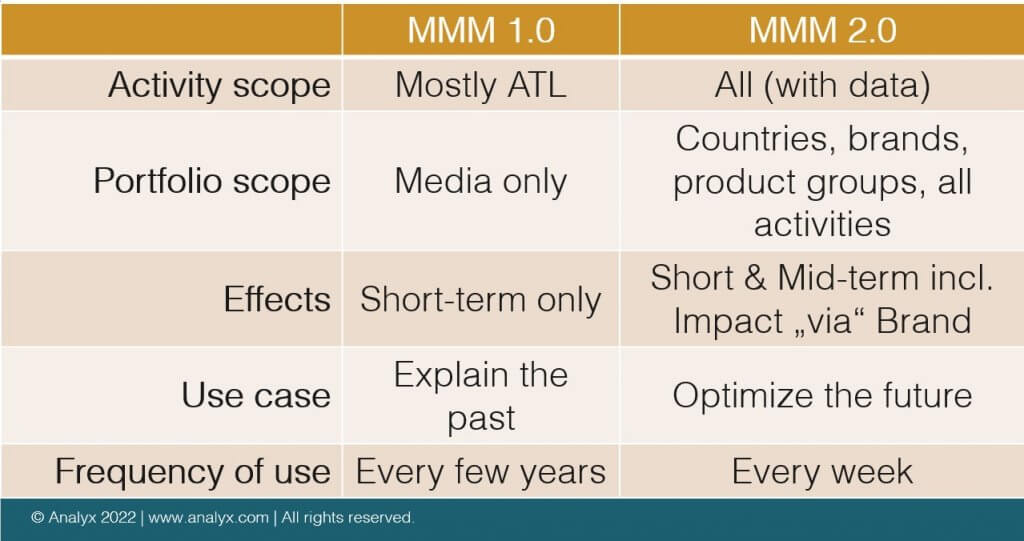
- BROADEN the portfolio scope: MMM 1.0 has often been translated into MEDIA Mix Model. MMM 2.0 goes way beyond media. Leading corporations use it already to optimize budget allocation across brands, products, categories, media channels – and even countries. Yes, this requires many models – actually one for every allocation unit (e.g. “Brand A x Product Group B x Country C”). But why is that a problem in the times of Datamarts, Modeling Platforms and ETL pipelines? In short: It isn’t!
- INCLUDE all activities: MMM 1.0 was often restricted to ATL. But MMMs are capable to measure and isolate ANY activity for which historic data on intensity (e.g. GRPs, visits, views) and costs per intensity are available. This means: MMM 2.0 is not limited to traditional media channels – it can and must be extended to any activity that costs money incl. POS activities, sponsorship etc.
- RECONCILE Performance and Brand: Common criticism of MMM 1.0 was that it only covers short-term effects and thus favors shifts into promotions or performance channels to the detriment of long-term brand building. These times are gone! Advanced MMM 2.0 explicitly includes mid- to long-term marketing effects via brand equity.
- Truly OPTIMIZE, don’t just explain the past: MMM 1.0 reports often give insights (sensitivity curves, decomposition, historic ROI). MMM 2.0 goes beyond that by providing mathematically optimized budget allocation incl. your strategic constraints. These optimized budgets don’t just take media effectiveness into account but also the fact that brands have different growth rates and profitability levels…
- Go AGILE: MMM 1.0 was a tedious exercise. Once every few years, brands would start from scratch, agencies had changed, everybody hated it. MMM 2.0 must be designed to support Agile Budgeting: Weekly or monthly datafeed, models are recalibrated 2-4x per year to reflect changes in media effectiveness fast. This allows informed, dynamic budget decisions without all the hassle.
To summarize:
Impact
Companies that implement MMM 2.0 experience sizeable financial impact:
- 1-4% revenue growth at constant marketing budgets (the best I have seen was 8,3%) OR
- 20-25% efficiency gains at constant revenues
And we are talking major brands here that certainly were not drastically suboptimal before! Setup costs are CAPEX and still typically pay back within a year which is much better than the 2-3 years for a MarTech stack or a CDP.
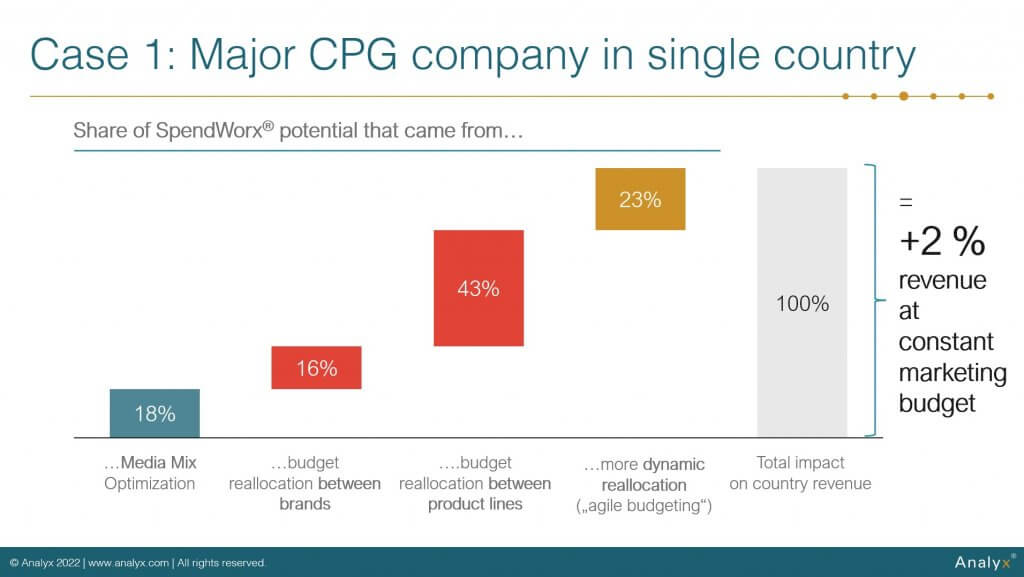
And to prove the points above: the impact in many cases is not driven dominantly by the good old (MMM 1.0) media mix optimization as the following two examples show. The first is one country from an MMM 2.0 implementation at a major consumer goods brand. Only 1/5 of the total potential stemmed from media mix (green). Almost 60% of the impact came from reallocating budgets between brands and product lines – an area that was driven by heuristics and rules of thumb previously. Another quarter of the impact came from introducing more frequent budget reallocation:
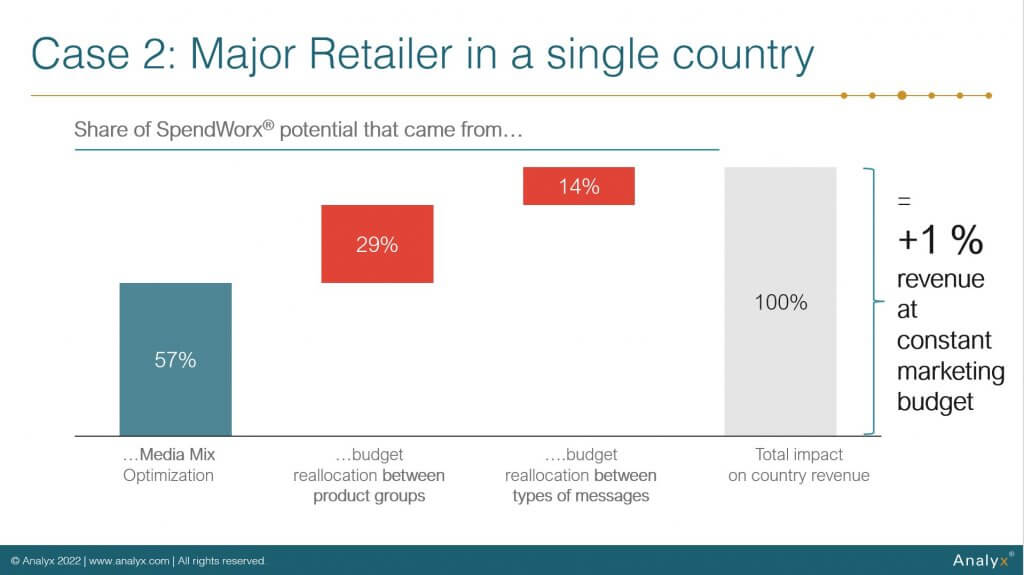
In the case of a major retailer – pictured below – classic media mix optimization was more important, responsible for >50% of the total revenue impact. But also here: reallocating budgets between advertised product groups and between types of marketing messages (e.g. image spots vs. price-oriented spots) made up the other half of the pie:
Upshot
In a world of fast-changing consumer demand and media channel explosion, CMOs cannot afford to leave money on the table (and get budgets cut instead). In response to that, MMM 2.0 is not a new econometrics toy. It is a major lever in not only proving Marketing’s value but in quantitatively justifying and actively optimizing budgets going forward.